The material in this repo covers how to run deep learning applications in HPC system. You can watch CNN tutorial in this link: https://www.youtube.com/watch?v=bNb2fEVKeEo
It is important to optimize your script for the single-GPU case before moving to multi-GPU training. This is because as you request more resources, your queue time increases. We also want to avoid wasting resources by running code that is not optimized.
Here we train a CNN on the MNIST dataset using a single GPU as an example. We profile the code and make performance improvements.
Follow the instruction of Conda Setup.
First login to CARC OnDemand: https://ondemand.carc.usc.edu/ and request a 'Discovery Cluster Shell Access' within OpenOnDemand.
cd /scratch2/$(whoami)
mkdir CARC
cd CARC
git clone https://github.com/uschpc/TRGN599-Profiling-DeepLearning-Codes.git
cd TRGN599-Profiling-DeepLearning-CodesFirst, inspect the script (see script) by running these commands:
$ cat mnist_classify.pyNote: nn.Conv2d(1, 32, 3, 1): This is creating a 2D convolutional layer. Here’s a breakdown of the arguments:
(a) 1: The number of input channels. This could be 1 for a grayscale image, 3 for a color image (RGB), etc.
(b) 32: The number of output channels (i.e., the number of filters or kernels). This means that the output of this convolutional layer will have 32 feature maps.
(c) 3: The size of the convolutional kernel (or filter). This means a 3x3 filter is used for the convolution.
(d) 1: The stride of the convolution, which controls how the filter moves across the input. A stride of 1 means the filter moves one pixel at a time.
We will profile the train function using line_profiler by adding the following decorator above the train function:
@profile
def train(args, model, device, train_loader, optimizer, epoch):
Below is the Slurm script:
#!/bin/bash
#SBATCH --job-name=mnist         # create a short name for your job
#SBATCH --partition=gpu          # gpu partition
#SBATCH --nodes=1                # node count
#SBATCH --ntasks=1               # total number of tasks across all nodes
#SBATCH --cpus-per-task=1        # cpu-cores per task (>1 if multi-threaded tasks)
#SBATCH --mem=8G                 # total memory per node (4 GB per cpu-core is default)
#SBATCH --gres=gpu:v100:1             # number of gpus per node
#SBATCH --time=00:10:00          # total run time limit (HH:MM:SS)
#SBATCH --account=sli68423_1965  # account name


# which gpu node was used
echo "Running on host" $(hostname)

# print the slurm environment variables sorted by name
printenv | grep -i slurm | sort

module purge

eval "$(conda shell.bash hook)"

conda activate torch-env

kernprof -o ${SLURM_JOBID}.lprof -l mnist_classify.py --epochs=3
#if you just want to run your python script, you can use: python mnist_classify.py --epochs=3
kernprof is a profiler that wraps Python.
Finally, submit the job while specifying the reservation:
$ sbatch job.slurmYou should find that the code runs in about 20-80 seconds with 1 CPU-core depending on which GPU node was used:
$ jobinfo 2387422
Job ID               | 2387422
Job Name             | mnist
User                 | haoji
Account              | sli68423_1965
Working directory    | /scratch1/haoji/CARC/TRGN599-Profiling-DeepLearning-Codes
Cluster              | discovery
Partition            | gpu
State                | COMPLETED
Exit code            | 0:0
Nodes                | 1
Tasks                | 1
CPUs                 | 1
Memory               | 8G
GPUs                 | 1 (a100)
Nodelist             | b02-01
Submit time          | 2025-09-17T10:36:04
Start time           | 2025-09-17T10:36:33
End time             | 2025-09-17T10:38:04
Wait time            | 00:00:29
Reserved walltime    | 00:10:00
Elapsed walltime     | 00:01:31
Elapsed CPU walltime | 00:01:31
Used CPU time        | 00:01:10.099
CPU efficiency       | 77.03%
% User (computation) | 94.13%
% System (I/O)       |  5.87%
Max memory used      | 23.21G (estimate)
Memory efficiency    | 290.15%
Max disk read        | 155.98M (estimate)
Max disk write       | 66.88M (estimate)
You can also check slurm-#######.out file.
We installed line_profiler into the Conda environment and profiled the code. To analyze the profiling data:
$ conda activate torch-env
$ python -m line_profiler -rmt *.lprof (this works only if you have one lprof file. Otherwise, try to specify your exact file name, e.g. 27805042.lprof)
Timer unit: 1e-06 s

Total time: 30.8937 s
File: mnist_classify.py
Function: train at line 89

Line #      Hits         Time  Per Hit   % Time  Line Contents
==============================================================
    89                                           @profile
    90                                           def train(args, model, device, train_loader, optimizer, epoch):
    91         3        213.1     71.0      0.0      model.train()
    92      2817   26106124.7   9267.3     84.5      for batch_idx, (data, target) in enumerate(train_loader):
    93      2814     286242.0    101.7      0.9          data, target = data.to(device), target.to(device)
    94      2814     296440.2    105.3      1.0          optimizer.zero_grad()
    95      2814    1189206.1    422.6      3.8          output = model(data)
    96      2814      81578.6     29.0      0.3          loss = F.nll_loss(output, target)
    97      2814    1979990.2    703.6      6.4          loss.backward()
    98      2814     841861.9    299.2      2.7          optimizer.step()
    99      2814       2095.3      0.7      0.0          if batch_idx % args.log_interval == 0:
   100       564       1852.9      3.3      0.0              print('Train Epoch: {} [{}/{} ({:.0f}%)]\tLoss: {:.6f}'.format(
   101       282       2218.6      7.9      0.0                  epoch, batch_idx * len(data), len(train_loader.dataset),
   102       282     105753.3    375.0      0.3                  100. * batch_idx / len(train_loader), loss.item()))
   103       282        119.2      0.4      0.0              if args.dry_run:
   104                                                           break

 30.89 seconds - mnist_classify.py:89 - train
The slowest line is number 92 which consumes 84.5% of the time in the training function. That line involves train_loader which is the data loader for the training set. Are you surprised that the data loader is the slowest step and not the forward pass or calculation of the gradients? Can we improve on this?
You can check gpu utilization using "watch -n 1 nvidia-smi" command. To exit watch session, use Ctrl + C.
Make sure you optimize the single GPU case before going to multiple GPUs by working through the Performance Tuning Guide.
One technique that was discussed in the Performance Tuning Guide was using multiple CPU-cores to speed-up ETL. Let's put this into practice.
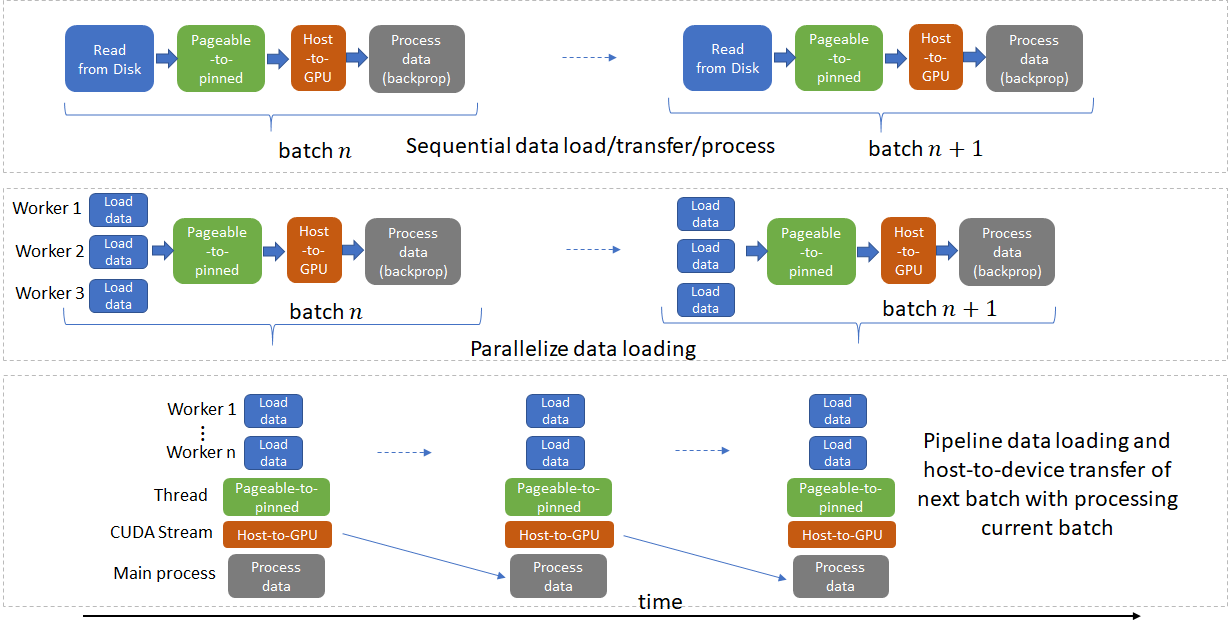
Credit for image above is here.
-
Pageable: This means that the memory can be paged in and out of physical memory to and from disk storage. In other words, the operating system can move this data between the main memory (RAM) and disk storage (swap space or page file) as needed. This is typically done to free up physical memory for other processes or tasks.
-
Pinned: This means that the memory is locked into physical RAM and cannot be paged out to disk. Pinned memory stays in physical memory for as long as it is needed and is not subject to the operating system’s paging mechanism. This is often used in situations where data must remain in memory for performance reasons, such as in real-time applications or certain kinds of device drivers.
So, “pageable to pinned” refers to the process of taking memory that was initially pageable (able to be swapped in and out) and converting it to pinned memory (locked into RAM). This might be done to ensure that certain critical data remains in memory and is accessed quickly without the risk of being paged out to disk.
In mnist_classify.py, change num_workers from 1 to 8. And then in job.slurm change --cpus-per-task from 1 to 8. Then run the script again and note the speed-up:
(torch-env) $ sbatch job.slurm
It is essential to optimize your code before going to multi-GPU training since the inefficiencies will only be magnified otherwise. The more GPUs you request in a Slurm job, the longer you will wait for the job to run. If you can get your work done using an optimized script running on a single GPU then proceed that way. Do not use multiple GPUs if your GPU efficiency is low.