Tutorials Preprocessing
The Data Builder makes new Data Blocks from existing ones. Its tools change which rows are present: every sub-tab creates a new child Data Block (made from another), and the source is never altered.
Tools that add or change columns (Combine columns, Count, Copy column, Extract text, Split column, Find & replace, Clean text) live in the Data Editor below the Project Graph. They update the selected Data Block in place and never change the number or order of rows.
There are currently eight sub-tabs:
| Sub-tab | What it does | Apply behaviour |
|---|---|---|
| Filter | Keep only the rows that match one or more conditions | New Data Block |
| Group | One Data Block per value, date period, or number range of a column | One new Data Block per group |
| Join | Combine two Data Blocks side-by-side on a shared column | New Data Block |
| Segment | One row per sentence, paragraph, line, or pattern-led segment, such as speaker turns | New Data Block |
| Aggregate | One row per group, such as one document per speaker, with a summary of each column | New Data Block |
| Sample | Extract a contiguous slice or a random subset of rows | New Data Block |
| Deduplicate | Keep the first of each duplicate, and save the duplicate groups separately | Two new Data Blocks |
| Stack | Put two or more Data Blocks that share the same columns one below the other | New Data Block |
The general workflow for any sub-tab is:
- Add one or more Data Blocks under Data Blocks.
- Configure the transformation.
- Review the Preview table to check the expected output.
- Click Add to Project (Group shows Add N to Project when N groups are ticked, one new Data Block per group; Deduplicate shows Add 2 to Project).
These controls appear across multiple sub-tabs and work the same way throughout.
Add Data Blocks under Data Blocks with Add Data Block, or with a Data Block's + button in the Data Blocks list or the Project Graph. Each sub-tab requires a specific number of Data Blocks: exactly two for Join, two to six for Stack, and one for the other tools. The heading shows how many are added out of the maximum (for example 1/1), and Add Data Block is greyed out once the maximum is reached. Remove a Data Block with its ×, or all of them with Clear. Segment, Aggregate, and Deduplicate also use the column chosen beside the Data Block (the Text column, or the Deduplicating column for Deduplicate).

A topic coverage column (TOPIC_coverage, made by Topic Modelling) is not listed in the column choices of Group, Join, Segment, Aggregate, or Deduplicate, because these tools cannot read it yet. Filter, Group, Join, Sample, Stack, and Deduplicate still carry it into their results unchanged, and Filter can also keep rows by a topic threshold on it.
The preview pane shows the result of the current configuration in a paginated format with an estimated row count. Check the preview before applying to confirm the output looks as expected. No Data Block is created until you click Add to Project.
Every Data Builder tool creates new Data Blocks and never changes its sources: one for Filter, Join, Segment, Aggregate, Sample (including Slice, Random sample, and Shuffle), and Stack; one per ticked group for Group; and two for Deduplicate. The source is preserved and the new Data Block records its creation lineage.
To add or change columns on the selected Data Block instead, use the Data Editor. Its edits keep the Data Block's identity, graph edges, and rows unchanged, and each one can be undone from the Data Editor header.
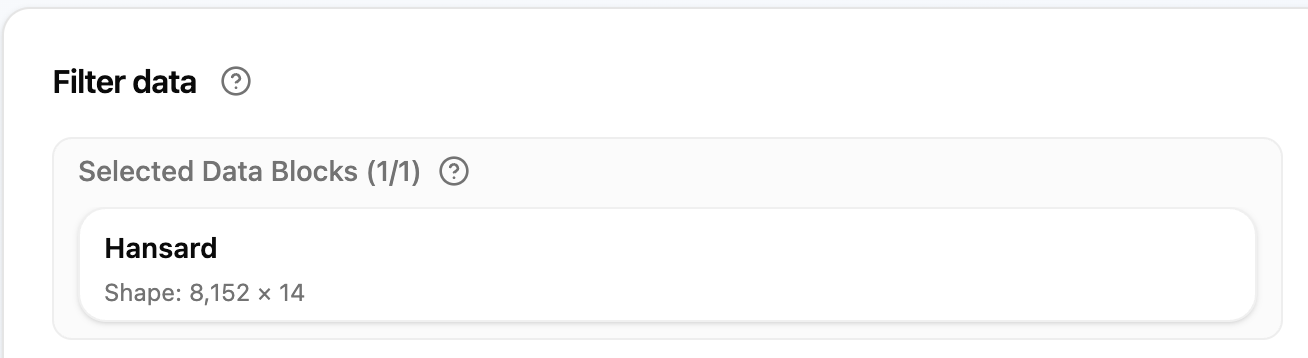
The Filter sub-tab keeps only the rows that match defined conditions. Use it to remove noise, focus on a subset, or create a clean working Data Block before analysis.
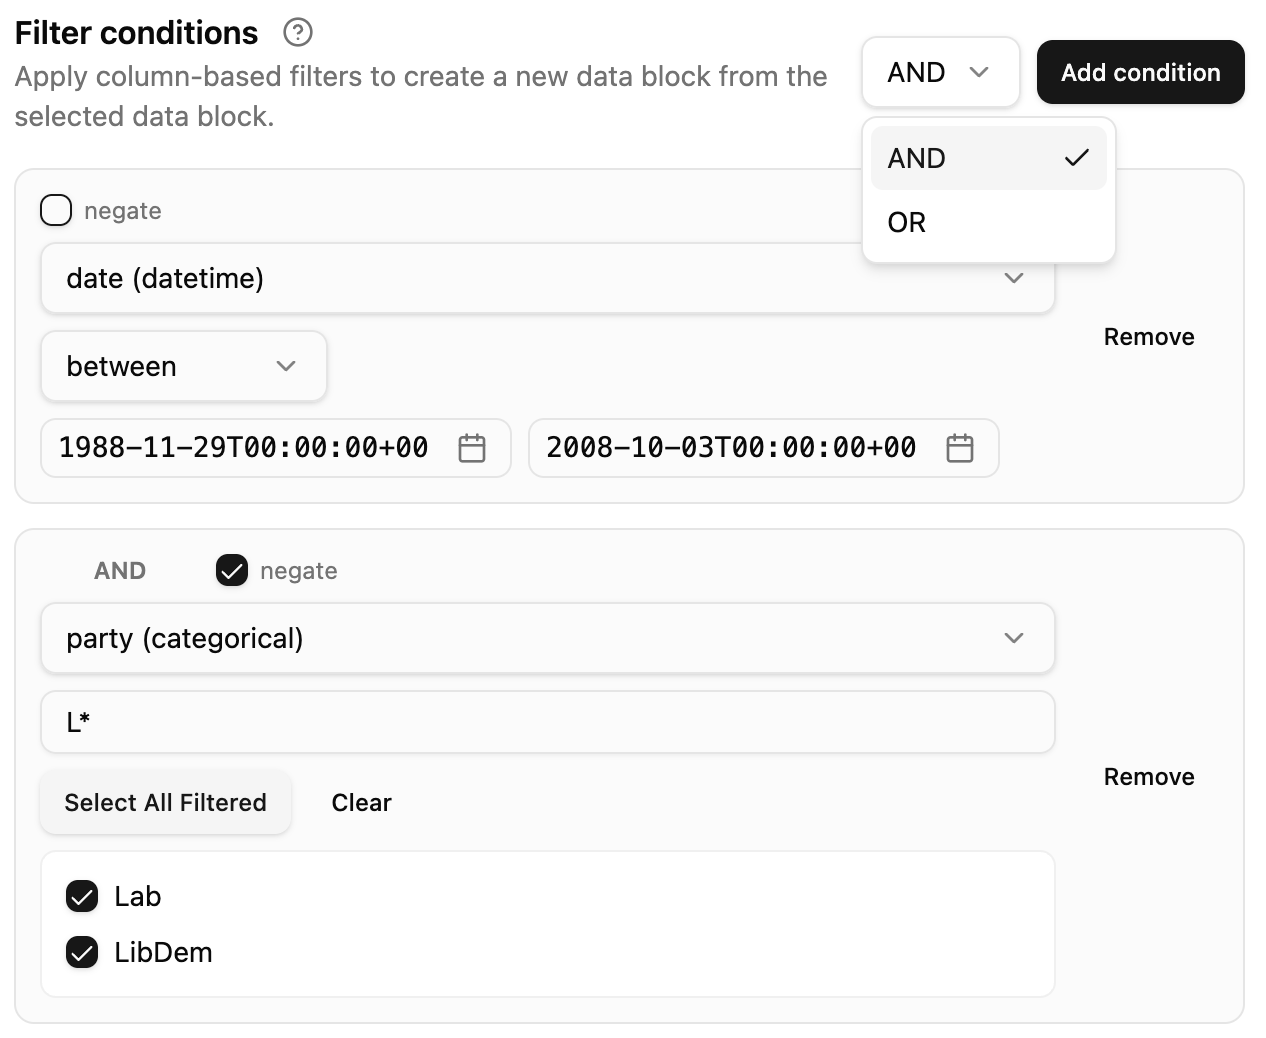
Define one or more column-based filter conditions. The behaviour of each condition depends on the data type of the selected column. All conditions are combined using either AND or OR logic (mixed logic chains are not supported).
- Click Add condition to add more conditions.
- Select AND or OR to control how conditions are combined.
- Check Negate on any individual condition to invert it.
- For a text column with the contains operator, tick regular expression to match a pattern instead of the exact text (see Regular expressions), and case sensitive to keep letter case distinct.
- When a selected column contains missing values, a warning reports how many. Ordinary filter conditions do not match those rows; choose is empty to target them explicitly. is empty matches missing values, NaN, and text that is empty or only spaces; tick Negate for "is not empty".
- The preview shows how many rows the current condition set would keep. An empty result is possible if no rows satisfy the conditions or if conditions conflict.
- Category values load in ordered pages. Scroll to load more, use search to filter on the server, and use Select all to select every value listed so far (values not loaded yet are not selected), or Select none to clear them. Existing selections remain selected across searches.
- In a value list, missing values are listed as (empty) and text that is empty or only spaces as (blank text).

Give the filtered output a descriptive name so it is easy to find in the Project. The new Data Block is a child of the selected source Data Block.
Practice exercise
- Select a Data Block with a clear category column.
- Add a condition that keeps only one category.
- Add the filtered result as a new Data Block and confirm the row count in the preview.
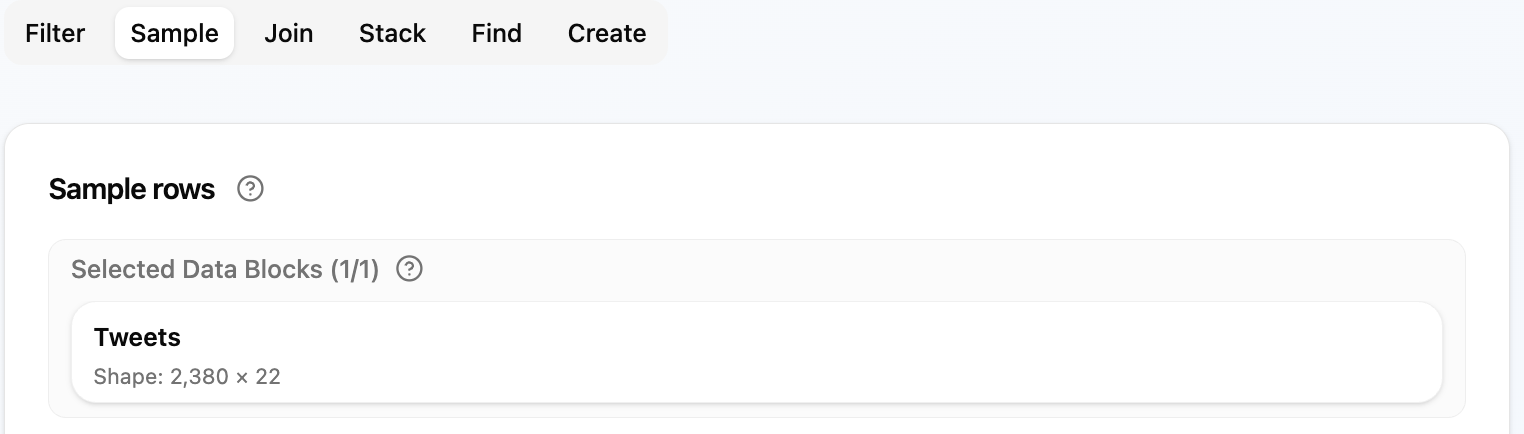
The Sample sub-tab extracts either a contiguous range or a randomly selected set of rows. A small representative subset makes exploring and debugging quicker than working with the full Data Block.
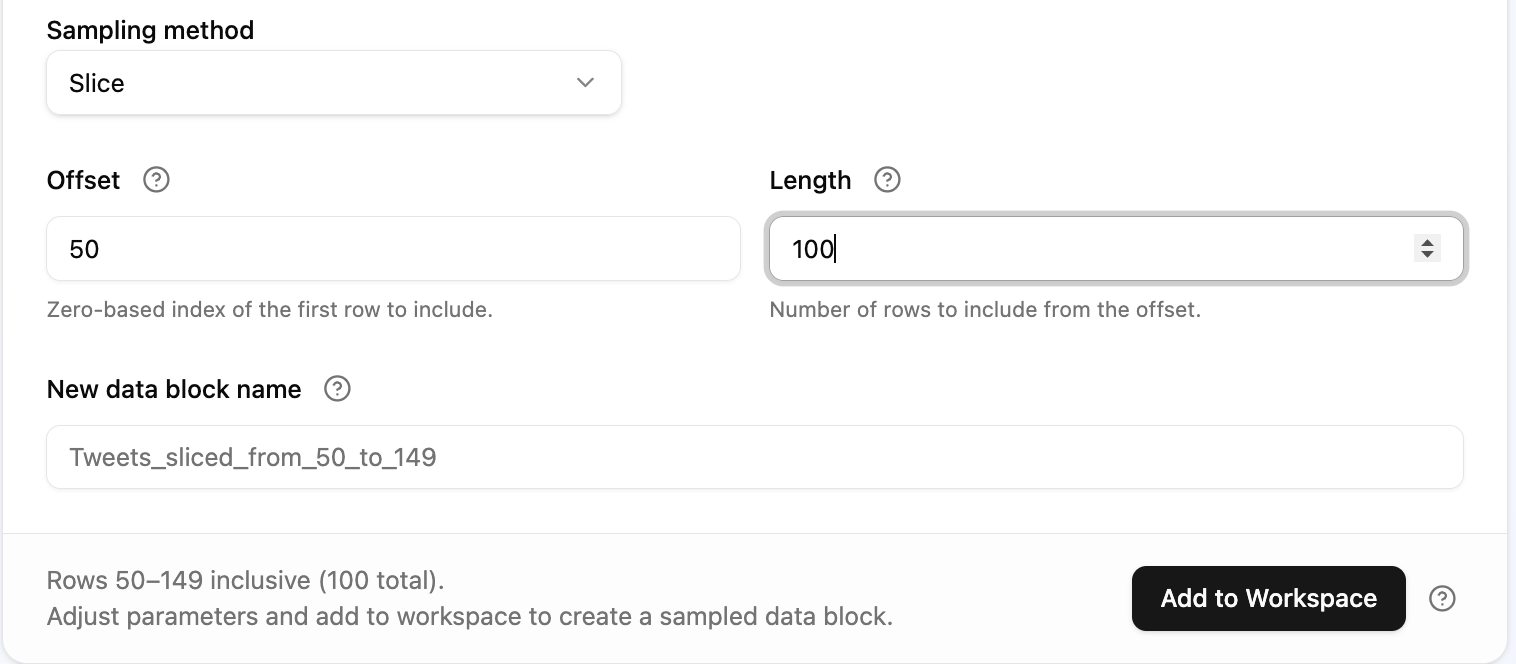
The slice option extracts a contiguous chunk of rows. Start row sets the first row to include (0 means the first row) and Length sets how many rows to include. Leave Length blank to slice to the end of the Data Block. For example, to extract rows 101–200 set Start row = 100 and Length = 100.
The number of rows to be sliced from the start row. Leave blank to slice from the start row to the end of the Data Block.
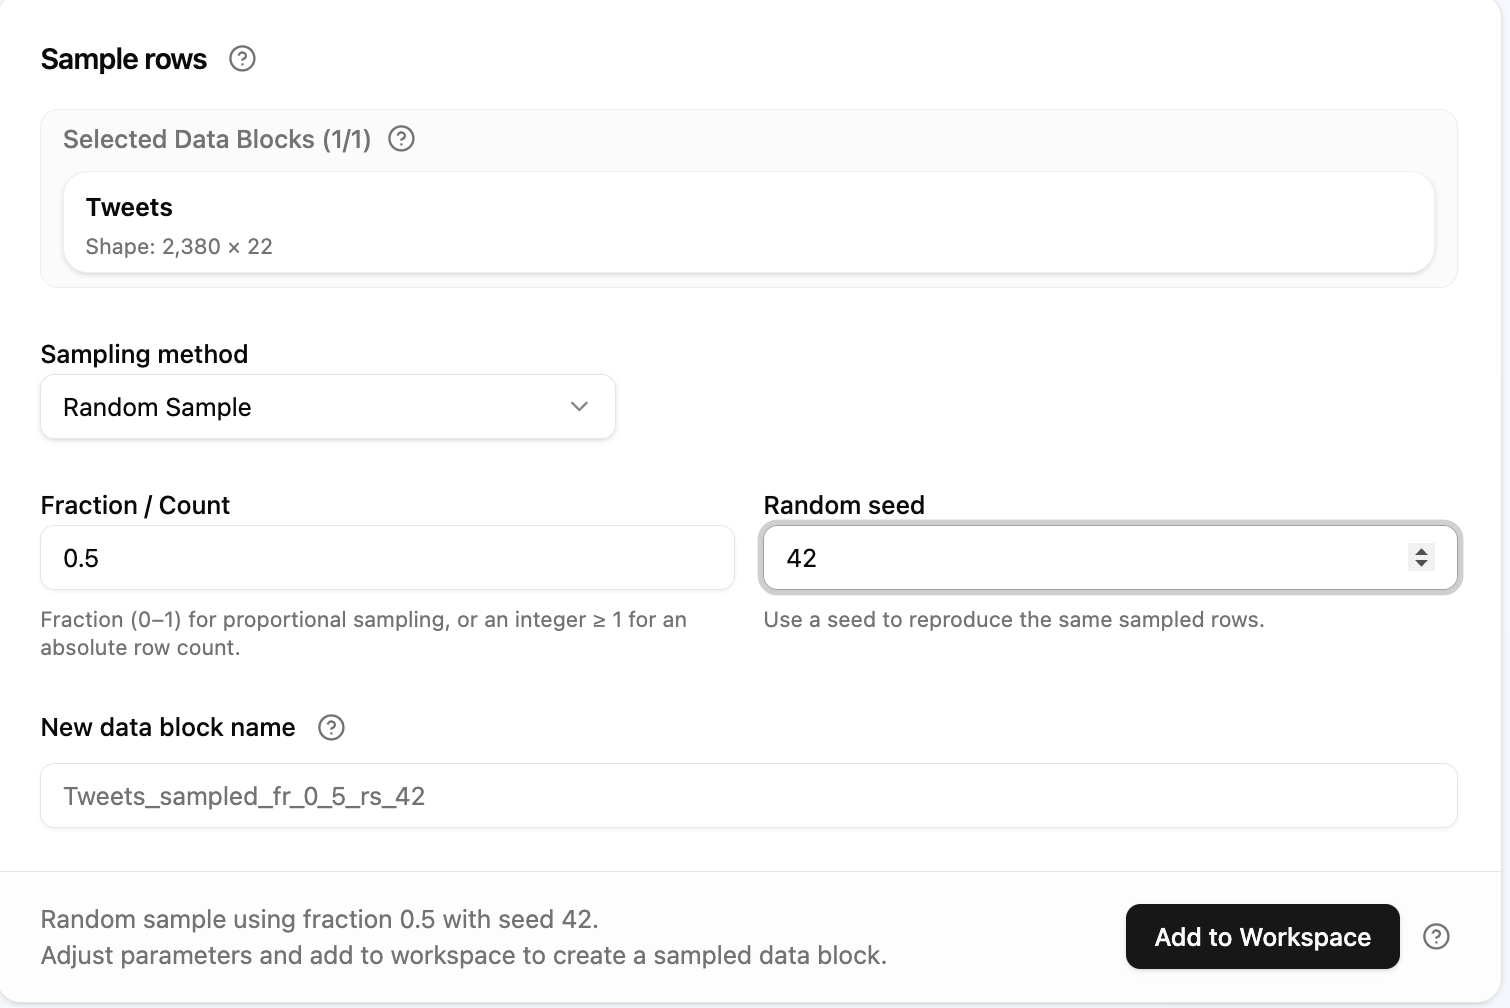
The random sample option extracts a randomly selected set of rows.
- Fraction: enter a decimal between 0 and 1 (e.g. 0.3 for 30 % of rows).
- Count: enter a whole number of rows to extract (e.g. 500). If the count exceeds the Data Block size, all rows are returned in shuffled order.
The random seed controls reproducibility. Using the same seed on the same data always produces the same rows.
- Use any non-negative integer (e.g. 0).
- Check No random seed to draw a truly random sample. Note that this makes the sample irreproducible and the randomness propagates to all child Data Blocks made from it.
The pre-populated name includes the sampling parameters. Edit it if you need a more descriptive label. Sample is create-only.
Practice exercise
- Select a Data Block with at least 200 rows.
- Try Slice with Start row 50 and Length 25, then try Random sample with Fraction 0.2 and a fixed seed.
- Add each result as a new Data Block and compare the row counts.
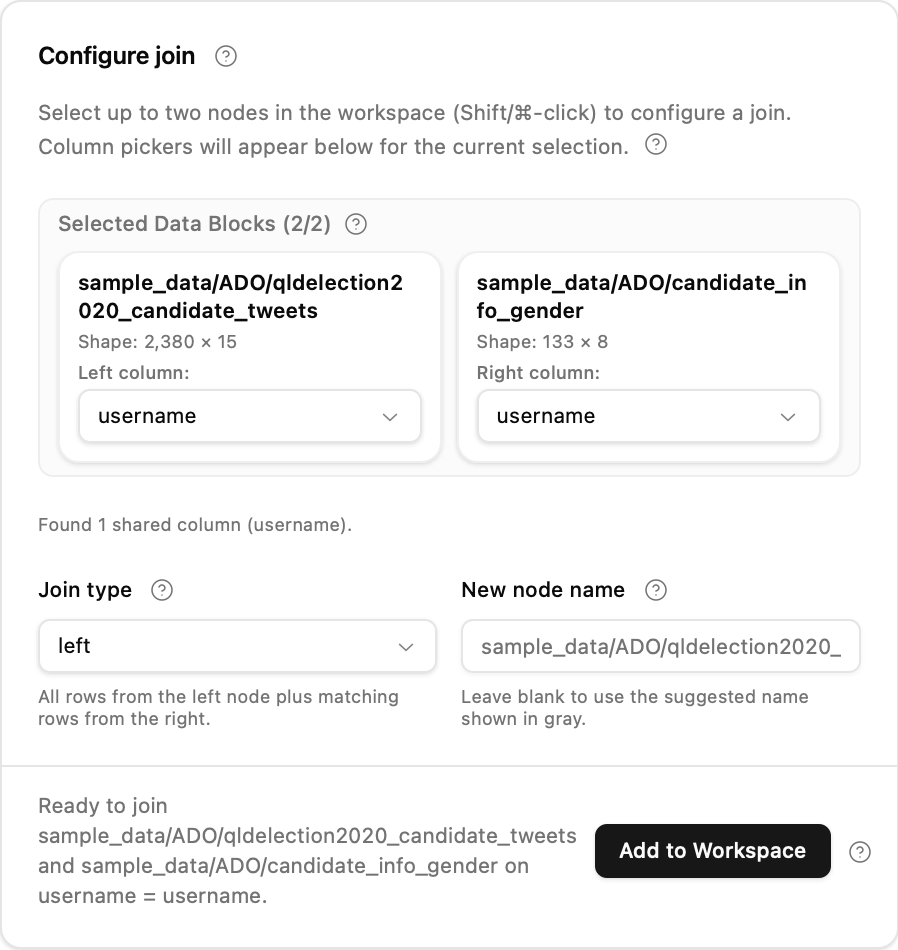
The Join sub-tab combines two Data Blocks side-by-side using matching columns. Use it when your text data is in one Data Block and metadata is in another, or when you need to enrich a Data Block before analysis. The result includes all columns from both Data Blocks, making it wider than either source.
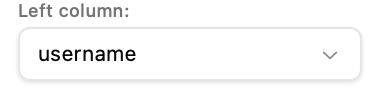
Choose which column to match in each Data Block. The app pre-populates the most likely shared columns, but you are responsible for selecting the correct joining columns. Use clean, consistent identifier columns for the best results.
Join type controls how unmatched rows are handled. The first Data Block you add is the left Data Block, and the second is the right Data Block. The explanation of the chosen type appears beside the selector.


| Type | Keeps |
|---|---|
| Left (default) | Every row of the left Data Block, with matching values from the right; rows without a match get empty cells |
| Inner | Only rows that match in both Data Blocks |
| Right | Every row of the right Data Block, with matching values from the left; rows without a match get empty cells |
| Full | Every row of both Data Blocks, matched where possible; missing values are left empty |
| Keep matches | Left rows that have a match in the right, without adding any right columns (for example, speeches whose speaker is in a list) |
| Keep non-matches | Left rows with no match in the right (for example, dropping documents listed in another Data Block) |
When both Data Blocks have a column with the same name, the right Data Block's copy is named after that Data Block, for example speaker_members when the right Data Block is members.
Give the joined output a clear name. Leave it blank to use the auto-generated suggestion. Join is create-only.
Practice exercise
- Select two Data Blocks that share an identifier column.
- Pick that column in both column pickers and run an Inner join.
- Compare the row count in the preview against both source Data Blocks.
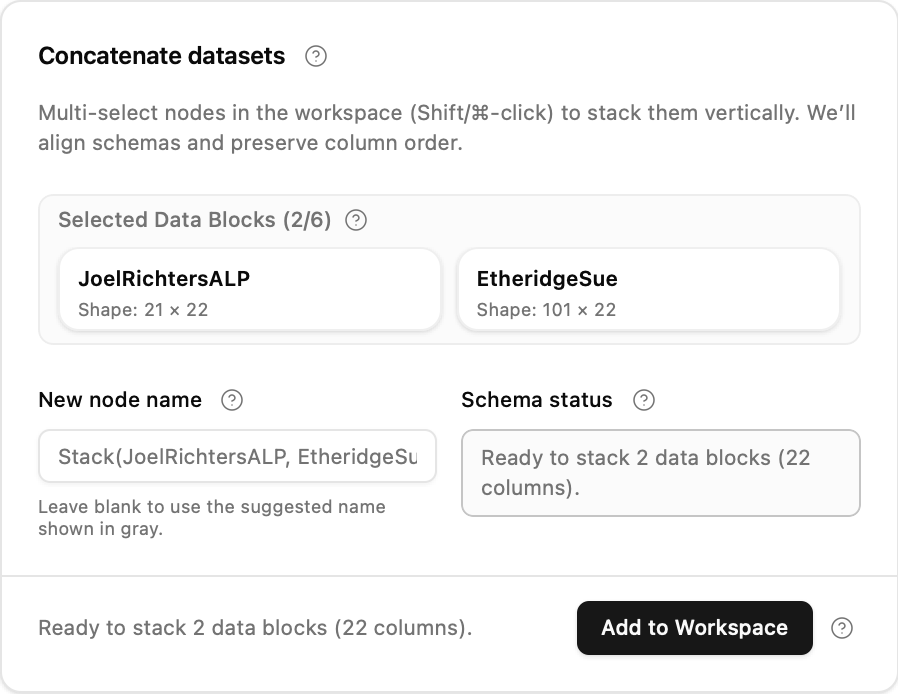
The Stack sub-tab puts two or more Data Blocks one below the other. Use it when you want to merge Data Blocks with identical column structures into one longer Data Block.
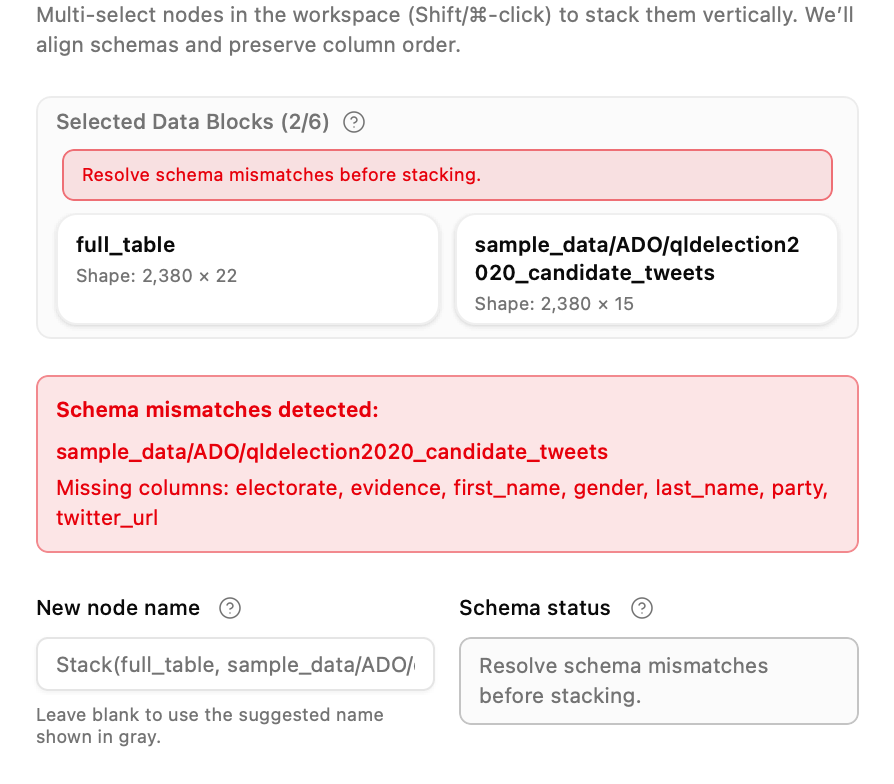
The Column check panel tells you whether all the Data Blocks share the same columns. If they don't, These columns don't match lists, for each Data Block, the columns it is missing, the extra columns it has, and any column whose type is different. Fix the column differences (e.g. by renaming or removing columns) before stacking.
Tick Deduplicate, beside Add to Project, to keep one copy of rows that are the same in every column of the stacked result. Two rows count as duplicates only when every column matches. Useful when stacking sources that may share overlapping records (e.g. partial dumps of the same dataset). To compare only some columns, or to keep a record of the duplicates, use Deduplicate on the stacked result instead.
Provide a label for the stacked output. Leave it blank to use the auto-generated suggestion. Stack is create-only.
Practice exercise
- Select two Data Blocks with the same column structure.
- Check the Column check panel to confirm the columns match.
- Add the stacked result and confirm the row count equals the sum of both sources.
Segment makes a new Data Block with one row per segment of the text column chosen in the inputs panel. Each segment keeps its source row's other columns, and a segment column counts the segments within each source row from 1, so you can trace every segment back.
-
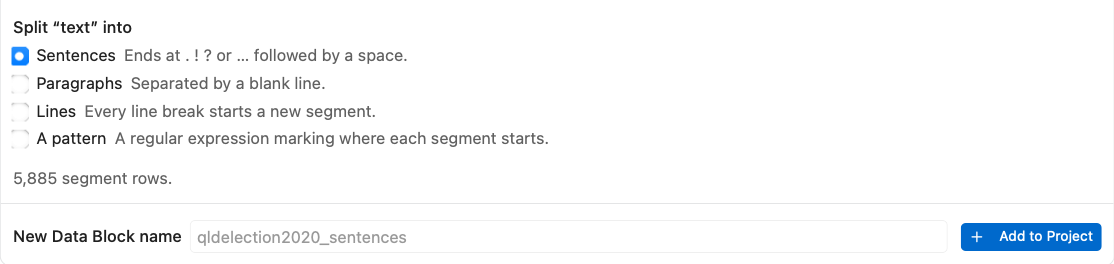
Sentences end at
.,!,?, or…followed by a space. A sentence keeps its own punctuation. This is a simple rule, so abbreviations such as "Dr. Smith" also end a sentence, and it can differ slightly from Topic Modelling's sentence option. - Paragraphs are separated by a blank line.
- Lines split at every line break.
-
A pattern is a regular expression marking where each segment starts;
^means the start of a line. For a transcript written asJOHN SMITH: Hello, the pattern^[\w\s]+:starts a segment at each speaker. Choose whether the matched text goes into its own column (for example speaker, with the trailing colon removed) or is dropped, like a delimiter. Text before the first match becomes segment 1.
The count below the choices (for example 5,885 segment rows) shows how many rows the new Data Block will have.
With A pattern selected, type the pattern and choose what happens to the matched text. Here each re-post of the form RT @user: starts a segment, and the matched text goes into a new column named retweet_of:
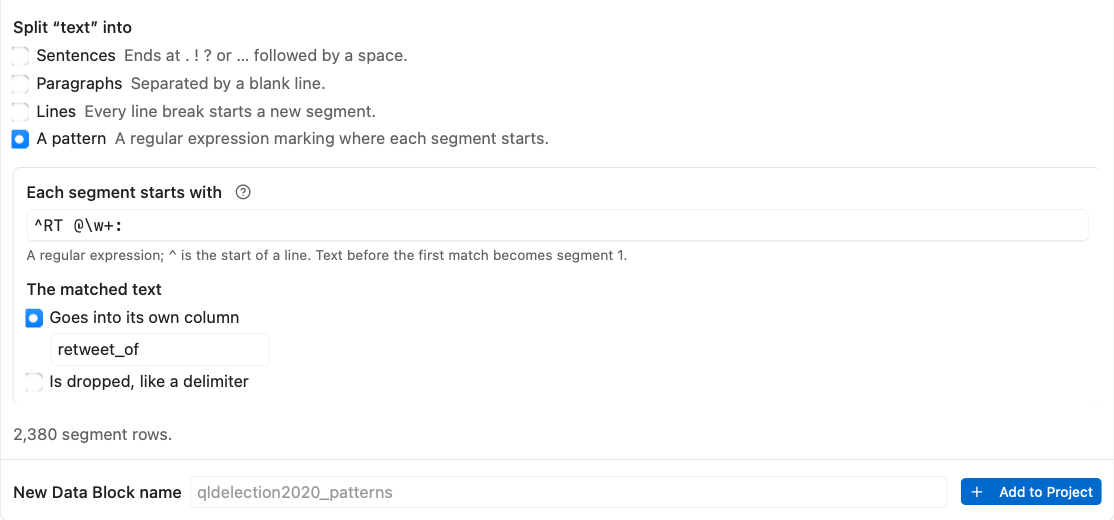
Separators are not kept, segments are trimmed, and empty segments are skipped.
Group makes one Data Block per group of a column (not to be confused with Aggregate, which makes one row per group), so analyses that compare Data Blocks need one step instead of several filters.
Choose the column under Split by; the choices below it depend on the column's type.
- For text and category columns, each value is a group. Values are listed with their row counts, most frequent first.
- For dates, group by year, year and month, or day.
- For numbers, use ranges of a fixed size from a start value, or split the full range into a number of equal ranges.
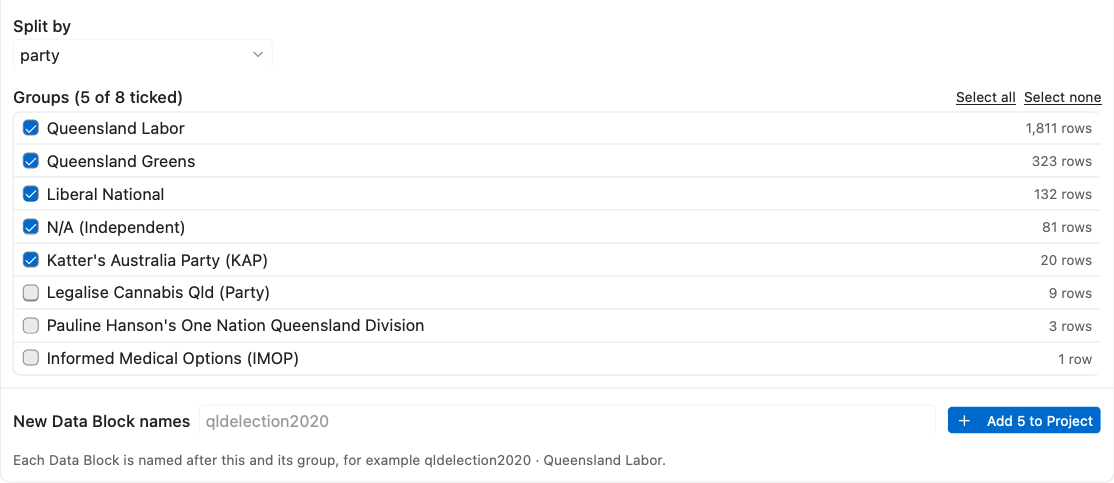
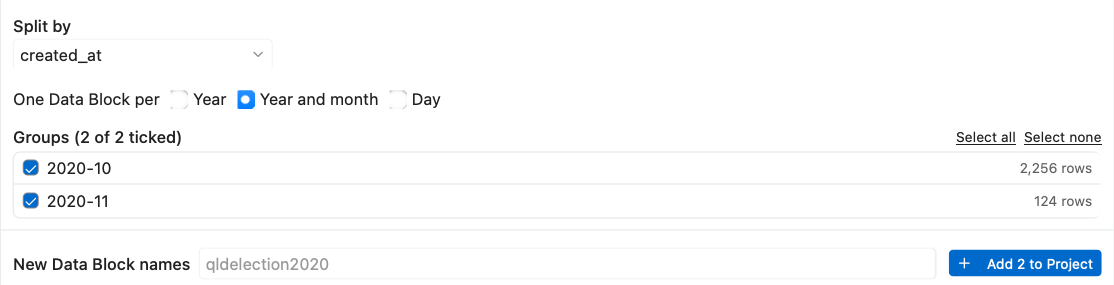
Every group starts ticked; untick any you don't need, or use Select all and Select none. The button shows how many Data Blocks will be made. Each Data Block is a Filter of the source, named like speeches · Labor; change the first part of the names under New Data Block names. At most 50 Data Blocks are made at a time. If a column has more groups, narrow the data first, for example with Filter.
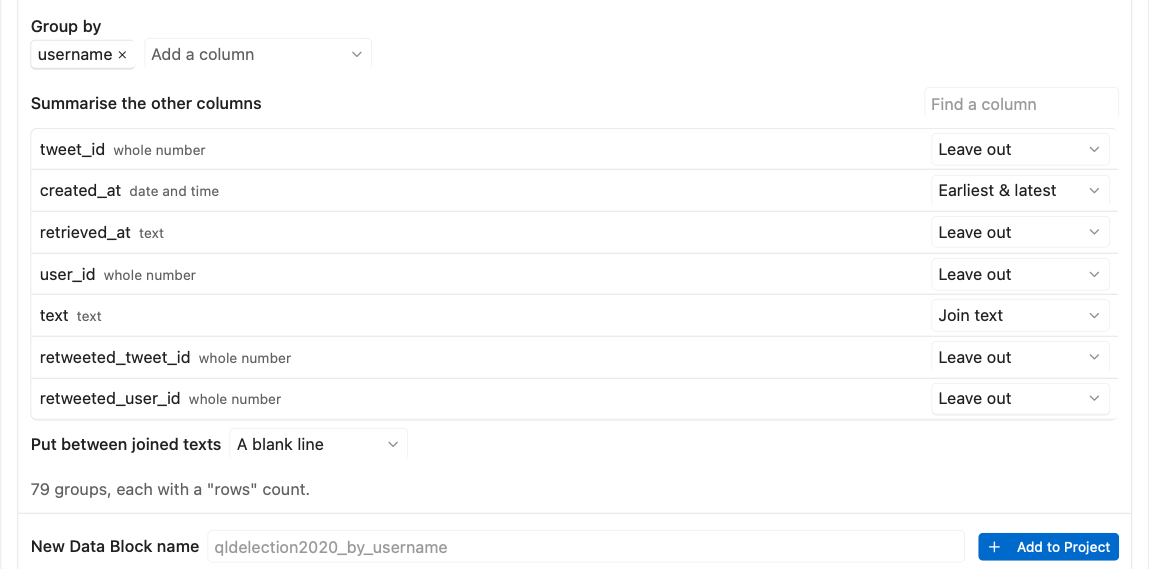
Aggregate makes a new Data Block with one row per group, for example one document per speaker. Choose one or more group by columns, then a summary for each other column:
- Text: Join text, Count distinct, Distinct values, First, Last
- Numbers: Sum, Mean, Minimum, Maximum, Count distinct, First, Last
- Dates: Earliest & latest, Earliest, Latest, Count distinct, First, Last
The defaults are cautious. The text column chosen in the inputs panel is joined, with a blank line between texts (change this under Put between joined texts). Dates keep their earliest and latest values. Every other column starts as Leave out, so ids are never joined or summed by surprise. A rows column always counts the rows in each group. Groups appear in the order they first occur. Use Find a column to find a column in a long list.
Deduplicate makes two Data Blocks and never changes the source:
-
…_deduplicatedkeeps the first row of each set of duplicates, in the original order. -
…_duplicatesholds every row that has a duplicate, including the kept one, with a duplicate_group number and a kept column, so you can check what matched.
Choose the Deduplicating column in the inputs panel: rows are always compared on it. Tick any Additional columns to include so rows must match on those too, or use Select all to compare whole rows. When the deduplicating column holds text, tick Match near-duplicate text to compare it after ignoring case, spacing, and punctuation. You can also ignore web links and @mentions, so a re-post such as RT @user: Save the reef! matches save the reef. The preview reports how many rows would be removed.